on
4 minutes to read
C4 Diagrams: A Guide to Visualizing Software Architecture
Making Engineering Diagrams speak for themselves
Show and Tell
I’m a very visual thinker, and when it comes to sharing ideas within the team, I will often try and distil things down to a diagram - which will usually sit at the top of my google doc. I always find it a delicate line with how much detail I try and get in to a diagram. Too much detail and the space gets crowded and nothing makes sense. Too little detail and the diagram may as well just be a sentence.
C4 Model
The C4 model, created by Simon Brown, provides a structured approach to visualizing software architecture at different levels of abstraction. It consists of four layers, each providing a different level of detail:
The different levels of zoom allow you to tell different stories to different audiences. That said, you don’t need to use all 4 levels of diagram; only those that add value
I’ll do my best to give an idea of the separate levels of abstraction, using the concept of making tea, where I have plenty of experience
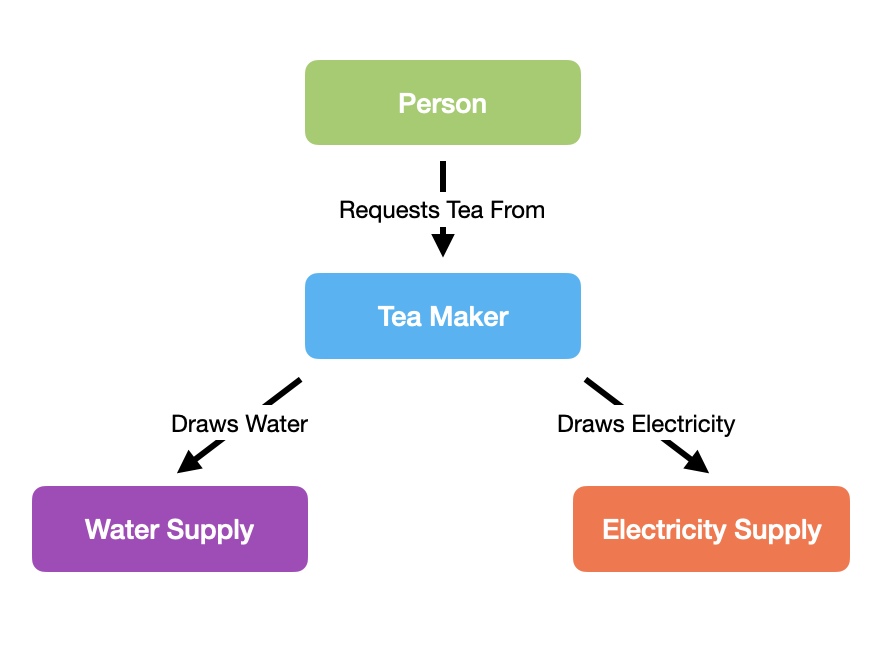
Level 1: System Context
The System Context diagram shows your system in relation to its users and other systems it interacts with. This high-level view helps stakeholders understand where your software fits in the bigger picture.

Here, our system sits between the user and the utilities providers.
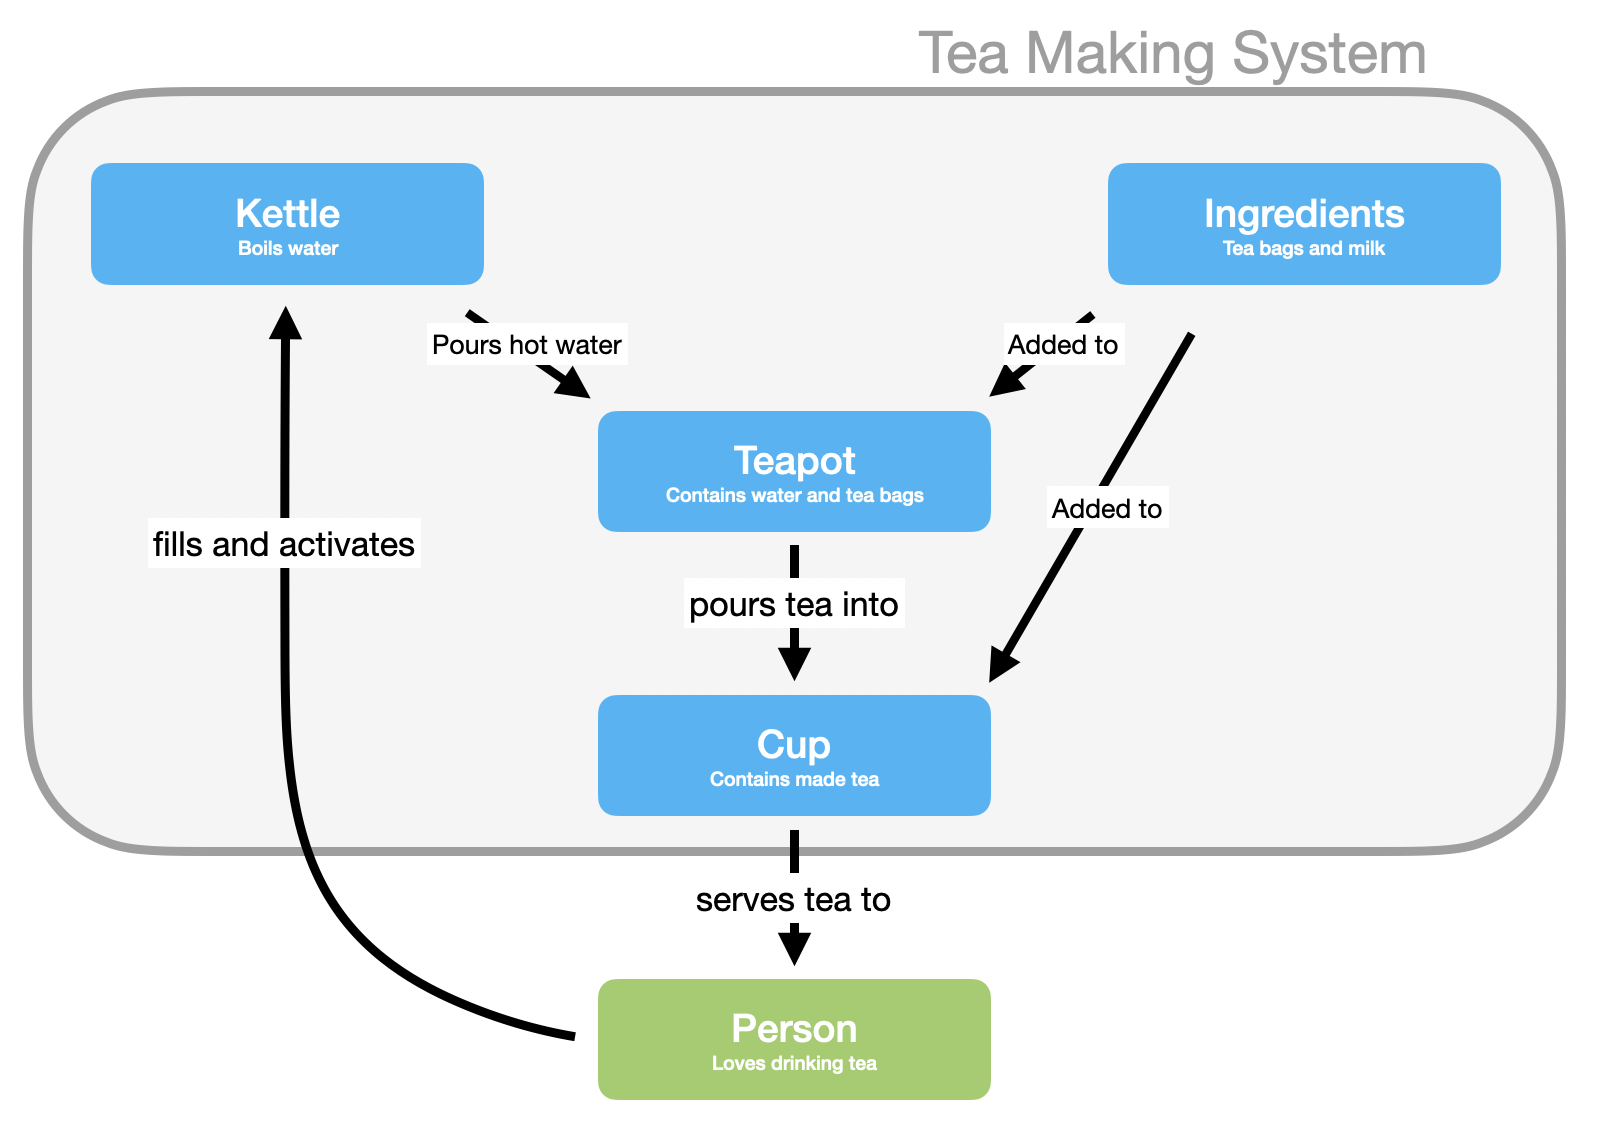
Level 2: Container
The Container diagram zooms in to show the high-level technical building blocks of your software system. Containers (not to be confused with Docker containers) represent applications or data stores that are part of your system.

Here we break down our system into the container level things - these are the main objects in our system that interact with each other across a boundary, but that are all part of this system
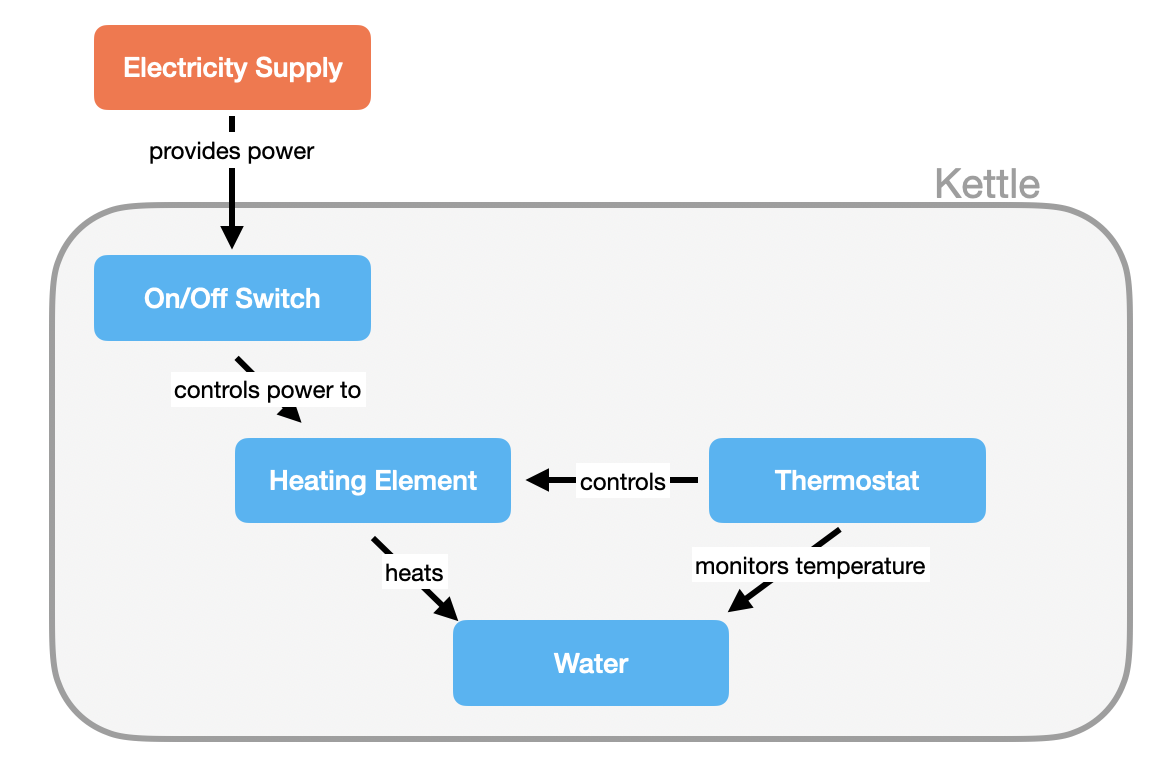
Level 3: Component
The Component diagram breaks down individual containers to show the major structural building blocks and their interactions. This level is useful for developers and architects to understand the system’s implementation strategy.

Zooming into one of the objects in our container, we focus on the kettle, this has its own internal logic for performing its job behind a well defined interface.
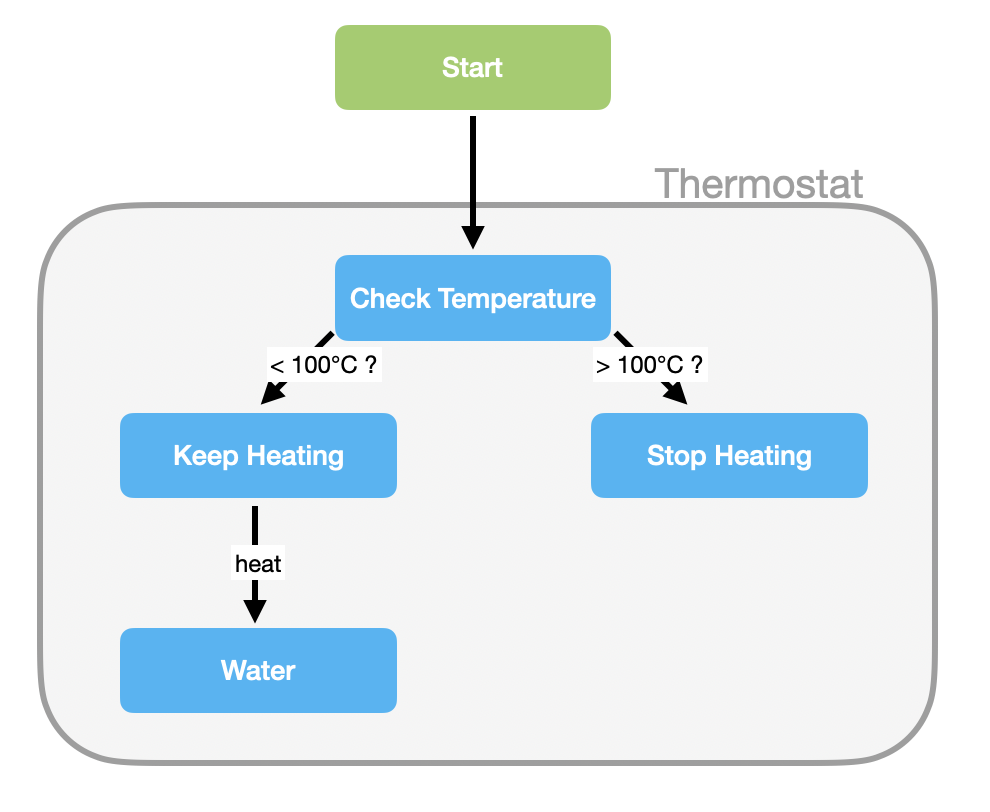
Level 4: Code
The Code diagram (optional) zooms in further to show how a component is implemented using classes, interfaces, etc. This level is typically generated from the codebase rather than maintained manually.

Diving into a class within our component, the thermostat is a cleanly defined blob of logic which heats water until it is hot enough, then it stops.
Overview
Each level of the C4 model builds upon the previous one, providing increasingly detailed views of your software architecture while maintaining clarity and purpose at each zoom level.
Some diagram recommendations I’ve stolen directly from the site because they are concise enough:
Diagrams
- Every diagram should have a title describing the diagram type and scope (e.g. “System Context diagram for My Software System”).
- Every diagram should have a key/legend explaining the notation being used (e.g. shapes, colours, border styles, line types, arrow heads, etc).
- Acronyms and abbreviations (business/domain or technology) should be understandable by all audiences, or explained in the diagram key/legend.
Elements
- The type of every element should be explicitly specified (e.g. Person, Software System, Container or Component).
- Every element should have a short description, to provide an “at a glance” view of key responsibilities.
- Every container and component should have a technology explicitly specified.
Relationships
- Every line should represent a unidirectional relationship.
- Every line should be labelled, the label being consistent with the direction and intent of the relationship (e.g. dependency or data flow). Try to be as specific as possible with the label, ideally avoiding single words like, “Uses”.
- Relationships between containers (typically these represent inter-process communication) should have a technology/protocol explicitly labelled.